
Learning Center
How to analyze a time series?
An essential step in an econometric analysis is a comprehensive investigation of the properties of your time series. Fortunately, the Econometrics Toolbox comes with a bundle of tools that provide standard econometrics routines that are necessary for a proper analysis of your data.
Maybe the best approach to introduce you with the Econometrics Toolbox data analysis capabilities is working with an example. In this section, we are going to analyze the following time series:
A |
B |
C |
|
1 |
Sample time series |
|
|
2 |
|
|
|
3 |
Time |
Value |
|
4 |
2010-01-31 |
145 |
|
5 |
2010-02-28 |
150 |
|
6 |
2010-03-31 |
178 |
|
7 |
2010-04-30 |
163 |
|
8 |
2010-05-31 |
172 |
|
9 |
2010-06-30 |
178 |
|
10 |
2010-07-31 |
199 |
|
11 |
2010-08-31 |
199 |
|
12 |
2010-09-30 |
184 |
|
13 |
2010-10-31 |
162 |
|
14 |
2010-11-30 |
146 |
|
15 |
2010-12-31 |
166 |
|
16 |
2011-01-31 |
171 |
|
17 |
2011-02-28 |
180 |
|
18 |
2011-03-31 |
193 |
|
19 |
2011-04-30 |
181 |
|
20 |
2011-05-31 |
183 |
|
21 |
2011-06-30 |
218 |
|
22 |
2011-07-31 |
230 |
|
23 |
2011-08-31 |
242 |
|
24 |
2011-09-30 |
209 |
|
25 |
2011-10-31 |
191 |
|
26 |
2011-11-30 |
172 |
|
27 |
2011-12-31 |
194 |
|
28 |
2012-01-31 |
196 |
|
29 |
2012-02-29 |
196 |
|
30 |
2012-03-31 |
236 |
|
31 |
2012-04-30 |
235 |
|
32 |
2012-05-31 |
229 |
|
33 |
2012-06-30 |
243 |
|
34 |
2012-07-31 |
264 |
|
35 |
2012-08-31 |
272 |
|
36 |
2012-09-30 |
237 |
|
37 |
2012-10-31 |
211 |
|
38 |
2012-11-30 |
180 |
|
39 |
2012-12-31 |
201 |
|
40 |
2013-01-31 |
204 |
|
41 |
2013-02-28 |
188 |
|
42 |
2013-03-31 |
235 |
|
43 |
2013-04-30 |
227 |
|
44 |
2013-05-31 |
234 |
|
45 |
2013-06-30 |
264 |
|
46 |
2013-07-31 |
302 |
|
47 |
2013-08-31 |
293 |
|
48 |
2013-09-30 |
259 |
|
49 |
2013-10-31 |
229 |
|
50 |
2013-11-30 |
203 |
|
51 |
2013-12-31 |
229 |
|
52 |
2014-01-31 |
242 |
|
53 |
2014-02-28 |
233 |
|
54 |
2014-03-31 |
267 |
|
55 |
2014-04-30 |
269 |
|
56 |
2014-05-31 |
270 |
|
57 |
2014-06-30 |
315 |
|
58 |
2014-07-31 |
364 |
|
59 |
2014-08-31 |
347 |
|
60 |
2014-09-30 |
312 |
|
61 |
2014-10-31 |
274 |
|
62 |
2014-11-30 |
237 |
|
63 |
2014-12-31 |
278 |
|
64 |
2015-01-31 |
284 |
|
65 |
2015-02-28 |
277 |
|
66 |
2015-03-31 |
317 |
|
67 |
2015-04-30 |
313 |
|
68 |
2015-05-31 |
318 |
|
69 |
2015-06-30 |
374 |
|
70 |
2015-07-31 |
413 |
|
71 |
2015-08-31 |
405 |
|
72 |
2015-09-30 |
355 |
|
73 |
2015-10-31 |
306 |
|
74 |
2015-11-30 |
271 |
|
75 |
2015-12-31 |
306 |
|
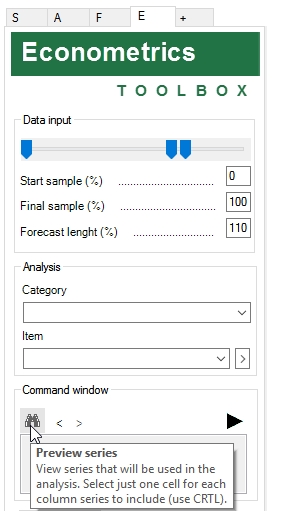
To analyze this series, go the Econometrics Toolbox tab, select any cell within the series range and then click on the green arrow in the command window.
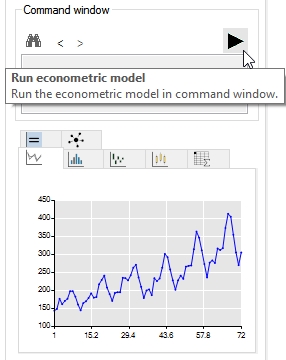
And that is it! Now you can check the following analysis of your data:
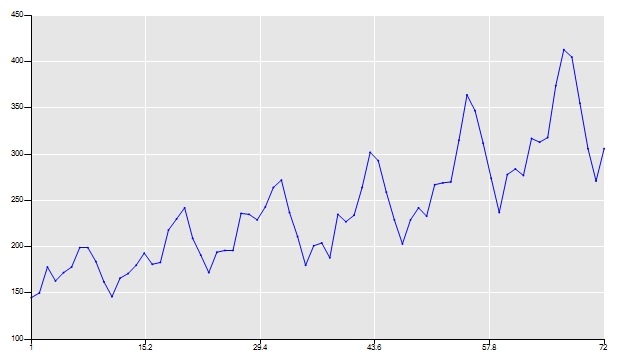
A series line chart (double click the chart to expand it):
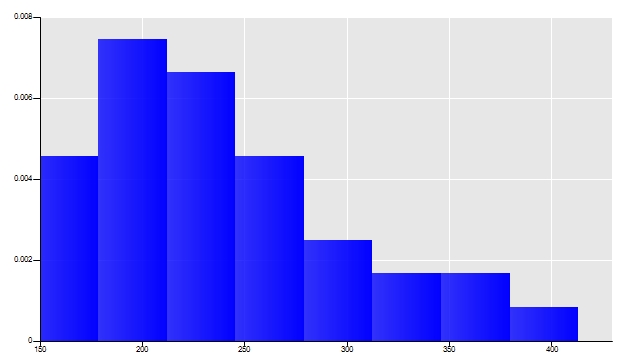
A density plot:
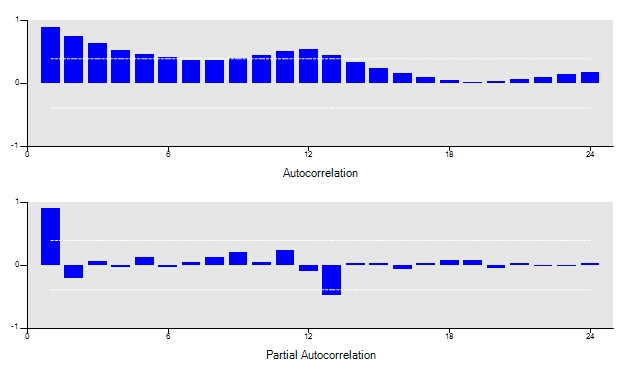
The autocorrelation and partial autocorrelation chart:
A box plot to check seasonality:
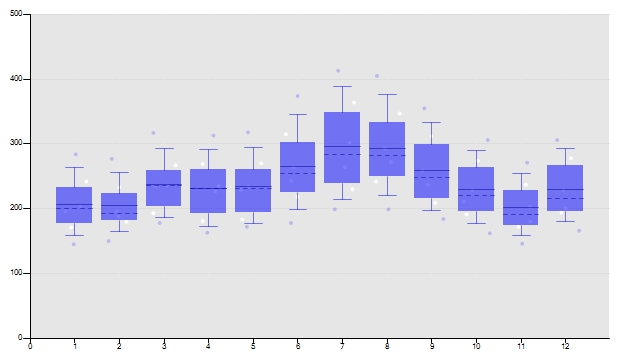
Note: The default seasonality is set to 12. To adjust this, just right click your data and type the seasonal length that you wish. You can also define which series your series begin (for instance, if you are investigating seasons in months and your series begin in March, type 3 in the “first value season” field.
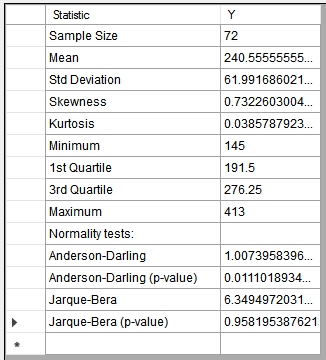
The summary statistics of your series:
You can go further in your analysis, analyzing any transformations of your data. Besides, if you are doing a regression analysis, you will have all the analysis mentioned above for the dependent variable (i.e., the series itself), the predicted series and the residuals.
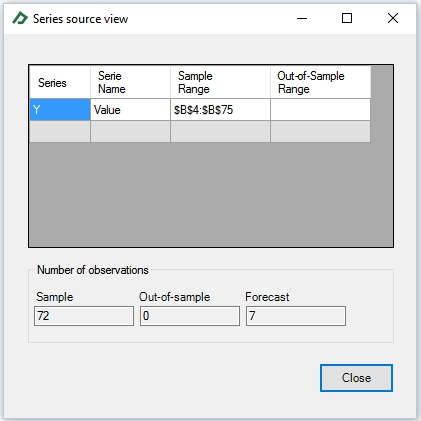
You can also investigate just some portion of your series, using the “data input” selection tool. Subsetting your data is made by changing the sliders thumbs (or changing the text input values) to use only the fraction of your data that you wish. In addition, to check the effective range that will be used in the analysis, just click on the “Preview series” button located in the command window.
The Econometrics Toolbox also deals well with missing values in your series. Some valid characters to represent missing values is “*” and “NA”. Please, pay attention that an empty cell is NOT a valid missing value. The standard internal procedure is to exclude the entire row containing a missing data from analysis or to ignore the missing values when it is not used for any calculus, for instance, to plot the time series. In the latter case, SAFE TOOLBOXES® will not plot anything in the index of series where there is no value.