
Learning Center
How to fit a distribution function to a sample?
Fitting a distribution to a sample is a quite simple procedure. Let’s do it with the data presented below:
A |
B |
C |
D |
E |
F |
|
1 |
Sample data: |
|
|
|
|
|
2 |
1.15 |
|
|
|
|
|
3 |
-0.23 |
|
|
|
|
|
4 |
-0.51 |
|
|
|
|
|
5 |
0.27 |
|
|
|
|
|
6 |
-0.42 |
|
|
|
|
|
7 |
0.6 |
|
|
|
|
|
8 |
0.29 |
|
|
|
|
|
9 |
0.86 |
|
|
|
|
|
10 |
-0.49 |
|
|
|
|
|
11 |
1.38 |
|
|
|
|
|
12 |
-1.15 |
|
|
|
|
|
13 |
-0.09 |
|
|
|
|
|
14 |
-1.02 |
|
|
|
|
|
15 |
0.71 |
|
|
|
|
|
16 |
-0.72 |
|
|
|
|
|
17 |
-0.38 |
|
|
|
|
|
18 |
-2.58 |
|
|
|
|
|
19 |
0.5 |
|
|
|
|
|
20 |
0.92 |
|
|
|
|
|
21 |
-0.73 |
|
|
|
|
|
22 |
|
|
|
|
|
|
The first step is to click on the fit button located at the top of the Simulation Toolbox tab. The following window will open.
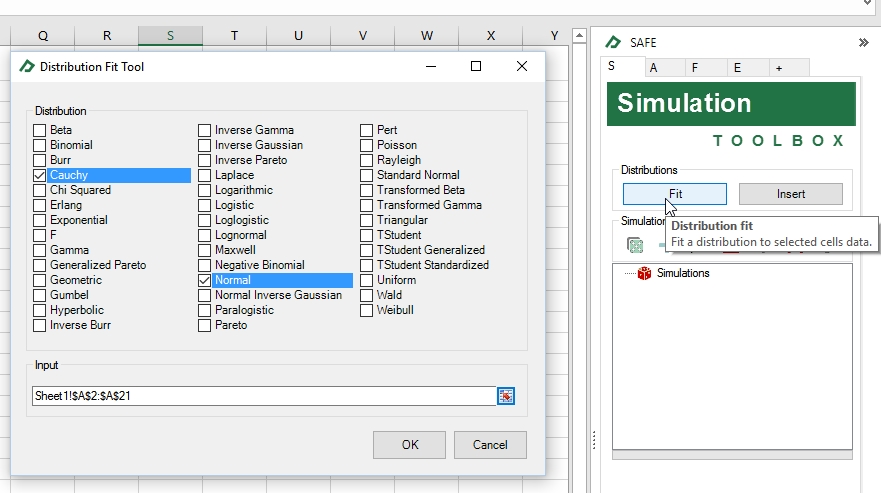
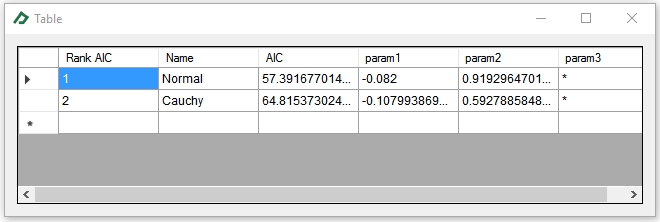
Select the desired distributions to fit the data and then click OK. A table will appear with the fitted parameters presented in the order that they are inserted in the correspondent distribution function. There will also be a column containing the Akaike Information Criterion that can be useful in selecting the distribution that better fits the data. By this criteria, the best-fitted distribution is the one that presents the lower AIC.
Another option to fit a distribution is applying the fit formula of the desired distribution to the data directly. All fit formulas obey the following syntax for the function names:
“s” + “FIT” + “_” + distribution name
You should insert the formula as any other Excel formula, but after insertion, you should click on the “Multiple Values Formula” button ![]() to display all fitted parameters.
to display all fitted parameters.